


In this article
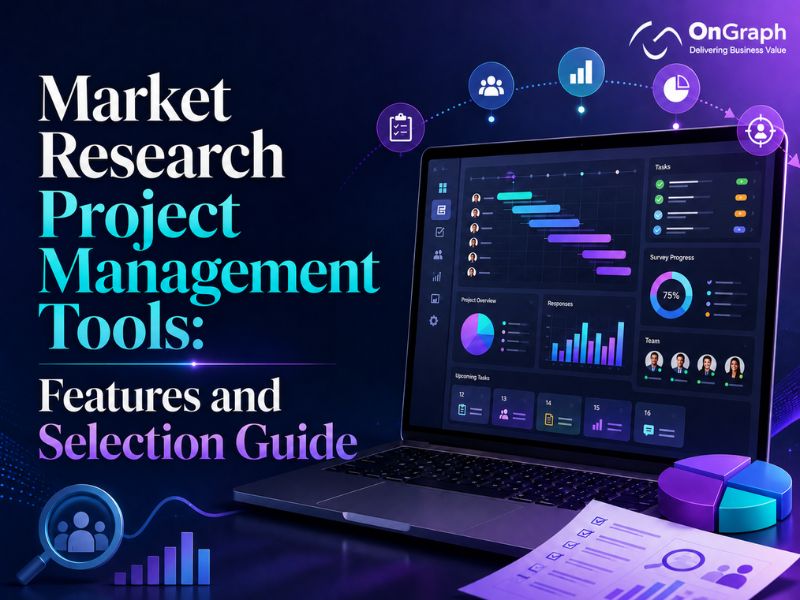
Market research project management tools manage the full bid-to-invoice lifecycle of a research project — bids and feasibility, quota setup, supplier and panel coordination, live fieldwork monitoring, data quality checks, reconciliation, and invoicing — where generic project management software only tracks tasks and deadlines.
The distinction has become strategic: ESOMAR sizes research software at $62 billion in 2024, a sector that grew 11.5% that year against 4.8% for research services, and GRIT’s 2025 Business Outlook scored tech-forward research suppliers 98.2 on its revenue-health measure versus 34.0 for full-service firms.
For agencies deciding what will actually run their operations, this guide covers the features that matter, how the tool landscape splits, and how to select — with a weighted-scorecard method built for research workflows.
What Makes Market Research Project Management Tools Different?
The clearest evidence is what happens when research teams try to run fieldwork on generic software. Asana’s own market research template handles research goals, task assignments, and intake forms — but has no concept of quotas, incidence rates, sample suppliers, or reconciliation, because generic tools have no research data model.
A January 2026 comparison by PM vendor awork catalogs the structural gaps for agencies generally: no native link between tracked time and project budgets, no billable-versus-internal distinction, and capacity planning based on task counts rather than actual team availability.
Market research adds its own layer on top — quotas, sample, and fieldwork constructs that no generic tracker models.
Tellingly, the category barely exists in software directories. Capterra’s closest category, “Market Research Software,” lists 259 products — dominated by survey and feedback builders — and surfaces essentially no project or fieldwork management capability; G2 has no research-specific project management category either.
So agencies stitch the gap together themselves. User Interviews’ 2023 State of User Research found UX researchers averaging 13 tools, and its 2025 edition reports 59% of user researchers still running operations on spreadsheets and documents.
A 2022 Harvard Business Review study measured the cost of that fragmentation — workers toggling between apps roughly 1,200 times a day, losing almost four hours a week to reorientation, about 9% of annual work time.
And field audits compiled by Raymond Panko at the University of Hawaii (spanning 1995–2004) found 86–94% of operational spreadsheets contain at least one error — which makes quota tracking in Excel an unpriced risk, not a thrifty workaround.
Turn Research Chaos Into One Connected Workflow
The Bid-to-Invoice Lifecycle: Feature Checklist by Stage
A research project’s economics are set at the bid and collected at the invoice. Market research workflow software earns its keep by carrying one data model across every stage in between:
| Lifecycle stage | What the software must do |
| Bid & feasibility | Manage bids and requirements; estimate feasibility and pricing against IR and LOI; assign winning bids to project managers |
| Project setup | Convert bids to projects; configure screeners, qualifications, and quotas without re-keying |
| Supplier & panel coordination | Integrate sample suppliers via API; pass quotas, statuses, completes, and quality indicators both ways |
| Fieldwork monitoring | Track completes, incidence rate, LOI, and term rates in real time; pace quotas; alert on drift |
| Data quality | Enforce S2S callbacks, hashing, deduplication, and fraud checks in the flow of fieldwork |
| Reconciliation & invoicing | Match completes against supplier IDs, generate client and supplier invoices, and report cost and margin per project |
Two of these stages deserve emphasis because almost nobody covers them. First, supplier coordination: modern sample marketplaces automate what used to be email chains — programmatic exchanges now return feasibility and pricing estimates in seconds and let quotas be edited mid-field, per Cint’s and PureSpectrum’s published capabilities — but only if the project platform speaks their APIs.
Second, reconciliation and cost-per-complete tracking: the fieldwork metrics project managers check daily — completes, term rates, incidence, quota fill — must flow into finance, or margin visibility arrives weeks after the project closes.
A decade-old Deltek-sponsored piece in Quirks described the still-recognizable alternative: project data scattered across a CRM, a standalone PM tool, timekeeping spreadsheets, and a separate finance package.
Generic Project Tracking Software, Research-Specific Platforms, or White Label?
The market splits into three camps, and the honest comparison prices all of them.
| Option | Example tools | Published pricing | Research data model | Bid-to-invoice coverage |
| Generic project trackers | Trello, ClickUp, monday.com, Wrike, Asana | $5–$25 per seat/month (billed annually) | None — tasks, timelines, approvals | None |
| Research-specific platforms | Forsta, Voxco, Nfield | Quote-only on major directories | Deep: multi-mode fieldwork, quotas, interviewer management | Partial — data collection focus |
| UX participant platforms | User Interviews, Great Question | ~$99–$205 per user/month, depending on plan | Participants and incentives only | None — no bids, suppliers, or invoicing |
| White-label research platforms | OnGraph and a small set of vendors | Custom, module-based | Full lifecycle: bids, quotas, suppliers, completes | Full — bid through invoice |
Generic project tracking software is cheap and transparent:
Published 2026 per-seat monthly rates (billed annually): Trello from $5, ClickUp from $7, monday.com from $9, Wrike from $10, Asana from $10.99, with business tiers between $12 and $25.
The catch is in the caps and gates: monday.com’s Standard tier allows only 250 automation and 250 integration actions a month, Asana sells time and budget tracking as a paid add-on, and Wrike gates resource planning and budgeting to its custom-priced Pinnacle tier. For task orchestration, these tools are excellent; for research operations, they are a shell around spreadsheets.
Research-specific platforms are deep but opaque:
Forsta (which claims eight of the top ten research agencies use its technology), Voxco, and Nfield cover multi-mode data collection — CAWI, CATI, CAPI — with real-time quota monitoring and interviewer management.
They are fieldwork infrastructure of real depth, but pricing is quote-only on major directories; implementations for enterprise research platforms run months rather than weeks per published vendor comparisons, and most focus on data collection rather than the bid-to-invoice commercial layer.
Participant-focused platforms from the UX world — what buyers sometimes shop for as research operations software — handle recruitment and incentives but never touch bids, supplier management, or invoicing.
White-label platforms are the middle path:
A pre-built research operations stack, deployed under the agency’s own brand, covering the lifecycle table above without an enterprise sales cycle or a greenfield build.
A small set of vendors offers this model — OnGraph’s white label market research platform among them — covering bid and scope management, single-dashboard fieldwork, supplier connections, quota rules, fraud prevention, and real-time cost and invoice tracking in one system.
How to Choose Market Research Project Management Software: 6 Steps
Software selection in committees goes wrong often enough that Gartner found 74% of B2B buying teams exhibit unhealthy conflict during the decision. The fix is boring and effective: weight the criteria before looking at demos, score every vendor against the same sheet, and let the arithmetic argue. A practical sequence:
1. Map requirements to the lifecycle. Score each stage of the bid-to-invoice table as Essential (3), Desirable (2), or Nice-to-have (1) for the agency’s actual project mix.
2. Test integration density. The average company now deploys 101 SaaS applications, per Okta’s Businesses at Work 2025 report — the shortlist question is which sample suppliers, survey engines, CRMs, and accounting systems connect natively, and what each additional integration costs.
3. Check compliance fit. ISO 20252 — the market research industry’s own quality standard — demands “transparent, consistent, well-documented and error-free” management of research projects, per CIRQ, the Insights Association’s certification body, and certification carries annual surveillance audits. Platforms with role-based access and audit trails make that inspection cheap; GDPR exposure (cumulative fines have passed €5 billion, per the CMS Enforcement Tracker) makes respondent-data handling a selection gate, not a nice-to-have.
4. Model total cost honestly. SaaS list prices rose 11.4% year-over-year as of January 2025 per Vertice’s index — roughly four times G7 inflation — and Zylo’s spend data shows 52.7% of purchased licenses sitting idle. Model per-seat growth, automation caps, and renewal uplift, and ask for a contractual price cap; procurement advisors report only about 29% of SaaS contracts include one.
5. Verify support and uptime. A 99.9% SLA still permits nearly nine hours of downtime a year — mid-fieldwork. The check is what the vendor commits to acknowledging versus resolving.
6. Plan adoption, not just purchase. Prosci’s benchmark research finds initiatives with excellent change management up to seven times more likely to meet objectives (88% versus 13%). A tool the fieldwork team routes around is a cost, not a capability.
Build the MR Platform Your Workflow Actually Needs
Build, Buy, or White Label?
For research project management software, the buy-side default works when needs are standard: a generic tool for task tracking plus manual coordination is viable at low project volume.
At scale, the calculus shifts — the gaps between systems are where completes go unreconciled and margins go unmeasured. Building custom is the other extreme: full control, but months of development before the first project runs through it.
The white-label route compresses that trade-off, and it is where OnGraph has concentrated its market research project management software: smart bidding that turns winning bids into fielded projects, one-click supplier API integration, and client and supplier invoicing from the same dashboard — a platform OnGraph reports has processed 8M+ completed surveys across 65+ panel integrations and 40+ API integrations.
For agencies that want the supplier layer examined in more depth, OnGraph’s supplier management software guide covers feasibility workflows, rate cards, and reconciliation in detail.
The selection question, reduced to one sentence: does the tool model research — bids, quotas, sample, completes, margins — or does it ask the team to keep modeling research in spreadsheets around it?
FAQs
A market research project management tool is software that manages the operational lifecycle of research projects — bid and feasibility management, quota and qualification setup, supplier and panel coordination, real-time fieldwork monitoring, data quality enforcement, and reconciliation and invoicing — in one system, rather than scattering those functions across task trackers, spreadsheets, and finance software.
Most agencies combine a generic project tracker (Trello, ClickUp, monday.com, Asana at roughly $5–$25 per seat monthly, billed annually) with spreadsheets and separate fieldwork tools — adjacent research-ops surveys report 59% of researchers still run operations on spreadsheets, and MR fieldwork teams show the same pattern. Research-specific platforms and white-label research platforms replace that patchwork with one lifecycle system.
They handle tasks, timelines, and approvals well, but have no research data model — no quotas, incidence rates, supplier integrations, completes tracking, or sample reconciliation. Automation caps and feature gating add friction at scale, which is why teams using them for research still depend on spreadsheets for actual fieldwork operations.
Generic project tracking software runs about $5–$25 per seat per month at published 2026 annual-billing rates. Research-specific enterprise platforms are quote-only, typically with multi-month implementations. White-label research platforms sit between the two — typically positioned as deployable under the agency’s brand in weeks rather than months; total cost depends on modules and customization depth.
The features that matter most are bid-to-project conversion, quota and qualification management, supplier API integrations, real-time fieldwork dashboards tracking completes, incidence, and LOI, built-in fraud and quality checks, and reconciliation with cost-per-complete and margin reporting. The last item is the most commonly missing — and the one that determines whether project profitability is visible before or after the project closes.
About the Author

Let’s Create Something Great Together!
Latest Blog

Let’s have a conversation today!


India
ONGRAPH TECHNOLOGIES PRIVATE LIMITED,
SDF L-1, NSEZ,
Sector 81, Block L, Phase-2,
Noida, Uttar Pradesh-201305

USA
OnGraph Technologies,
120 Bethpage Rd, Suite 304,
Hicksville, NY 11801, USA

Canada
7-1039 CEDARGLEN GATE,
Mississauga, Ontario,
Canada L5C 3A7

UK
89 Banstead Road South,
Sutton, Surrey, SM2 5LH
United Kingdom

Malaysia
G-3A, Amaya Maluri, Jalan
Jejaka 2, Taman Maluri,
KL–55100, Malaysia

Singapore
10 Anson Road,#26-04
International Plaza,
Singapore (079903)