


In this article
- Where Manual Work Builds Up in Research Operations
- Manual vs Automated Research Operations
- Where Market Research Automation Software Can Reduce Manual Work
- What Should You Automate First?
- What Automation Should Not Do
- Generic Automation Tools vs Research-Specific Software
- How Much Manual Work Can Research Automation Reduce?
- How to Implement Market Research Automation Software
- When Custom Market Research Automation Software Makes Sense
- Where OnGraph Fits
- The Bottom Line
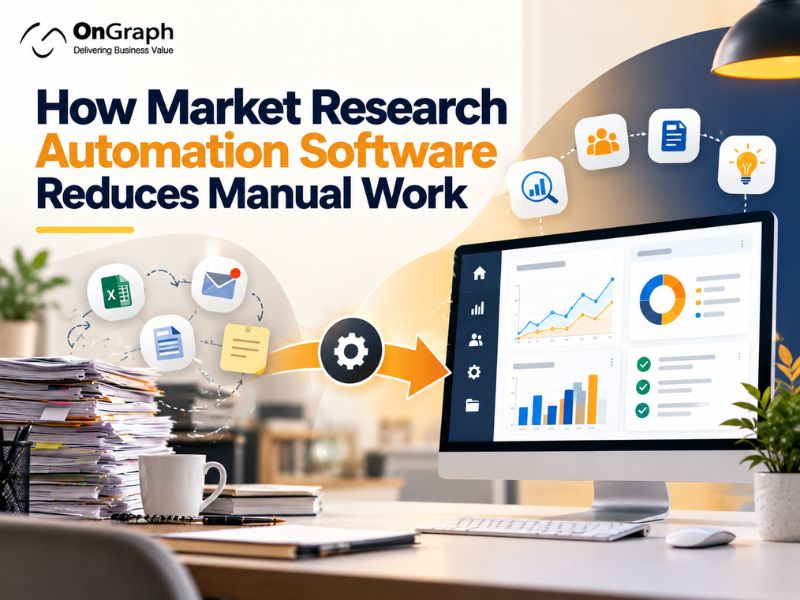
Market Research Automation Software helps research teams reduce the repetitive work involved in running studies, from project setup and supplier coordination to quota monitoring, reporting, reconciliation, and invoicing. Instead of moving the same information between emails, spreadsheets, survey tools, supplier portals, and finance systems, teams can keep the workflow connected.
The problem is often not that research teams lack software. It is that they use several tools that do not share information properly. A project manager may still copy client requirements into a project sheet, request feasibility through email, check quotas in another system, download supplier reports, and prepare status updates manually.
That administrative work can take a meaningful part of the workday. Asana’s 2023 Anatomy of Work research, cited in OnGraph’s research operations analysis, found that knowledge workers spent 58% of their time on “work about work.” A Harvard Business Review study estimated that switching between applications alone consumed around 9% of annual work time. These figures cover knowledge work broadly rather than market research specifically, but they help show why disconnected workflows create an operational cost.
For research agencies, the useful question is therefore not:
“What can we automate?”
It is:
“Which repetitive handoffs can we remove without losing the checks that protect research quality?”
Where Manual Work Builds Up in Research Operations
A research project can pass through sales, project management, survey programming, sample suppliers, quality teams, reporting, and finance before it is complete.
Each handoff can create another manual task.
For example, a project manager may receive specifications from sales and then manually create the project. Supplier feasibility may be requested separately. Quotas are configured in the survey or project system. During fieldwork, supplier delivery and quota progress need to be checked repeatedly. Once the study closes, completes must be reconciled before client and supplier invoices can be prepared.
The individual tasks may only take a few minutes. The problem is repeating them across dozens or hundreds of projects.
OnGraph’s analysis of research operations also cites Wellingtone’s 2021 State of Project Management report, which found that 50% of project professionals spent at least one day each month manually producing status reports, while 47% lacked access to real-time project KPIs. Again, this is a general project-management benchmark rather than a market-research-specific statistic, but it illustrates the cost of manually rebuilding information that already exists elsewhere.
Still Running Research Operations Manually?
Manual vs Automated Research Operations
| Research Activity | Manual Workflow | Connected Automated Workflow |
| Project Setup | Re-enter brief and bid details | Create project from approved bid |
| Supplier Feasibility | Email suppliers individually | Request through connected supplier APIs |
| Quota Setup | Configure across separate tools | Carry approved requirements into fieldwork |
| Supplier Allocation | Update spreadsheets | Manage allocation from project dashboard |
| Fieldwork Monitoring | Check multiple portals | View live project data centrally |
| Status Reporting | Prepare reports manually | Update dashboards from live project data |
| Quality Checks | Review separate files | Apply rules and flag exceptions |
| Reconciliation | Compare supplier files manually | Match supplier and project records |
| Client Invoicing | Re-enter project information | Generate draft from approved project data |
| Supplier Invoicing | Reconcile after fieldwork | Use accepted delivery and agreed rates |
The important difference is not simply that one side uses more software.
The automated workflow reuses information that has already been entered and approved.
Where Market Research Automation Software Can Reduce Manual Work
Not every part of research should be automated. Research design, unusual quality issues, client discussions, methodology decisions, and interpretation still require judgment.
The strongest opportunities are repetitive tasks where the rules are already known.
1. Bid and Project Setup
A research project often starts with information that already exists in the bid:
- Client
- Markets
- Audience
- Target completes
- Incidence rate
- Length of interview
- CPI
- Timelines
- Supplier requirements
- Additional services
When a bid is approved, these details should not have to be entered again.
A connected workflow can turn an accepted bid into a project record and carry the relevant specifications forward. The project manager can review the information and make changes rather than rebuilding the project from scratch.
This is one of the differences between generic task software and purpose-built market research project management software. OnGraph’s platform, for example, connects bid management with project fielding, suppliers, quotas, reporting, and invoicing.
2. Supplier Feasibility and Selection
Sample sourcing can create significant coordination work when a study uses several suppliers.
A project manager may need to send specifications, collect feasibility, compare CPI, check geographic coverage, and decide how much sample to allocate to each supplier.
Supplier APIs can reduce some of these handoffs.
Where supported, the project system can send requirements and receive information such as:
- Feasibility
- Pricing
- Audience availability
- Supplier coverage
- Project status
The project manager still decides which supplier to use. The automation reduces the administrative work required to collect the information.
For agencies working with several providers, market research supplier management software can also connect supplier records, feasibility, fieldwork, costs, and reconciliation with the wider project workflow.
3. Qualifications and Quota Management
Quotas are one of the areas where generic workflow automation is not enough.
A research project may need 1,000 completes, but those completes can be divided across age, gender, location, profession, income, or other qualification criteria.
During fieldwork, the platform needs to know which cells are:
- Open
- Nearly Full
- Complete
- Over Quota
- Underperforming
When this information is visible centrally, project managers do not need to repeatedly compare survey reports and spreadsheets to understand what is still required.
Rules can also pause or redirect traffic when quota conditions are met.
The purpose is not to remove the project manager. It is to reduce the amount of routine checking required to know where attention is needed.
4. Fieldwork Monitoring
Live fieldwork produces more information than a normal project tracker is designed to understand.
Research teams may need to watch:
- Completes
- Incidence Rate
- Length of Interview
- Termination Rate
- Quota Progress
- Supplier Delivery
- Quality Rejects
- Cost Per Complete
Generic project management software mainly tracks tasks and deadlines. Research-specific systems need to understand these fieldwork measures.
OnGraph’s current research project management guide makes the same distinction: generic tools do not naturally model quotas, incidence rates, sample suppliers, completes, or reconciliation.
Instead of project managers checking several sources, the platform can update the fieldwork dashboard as new data arrives.
This changes the PM’s job from collecting status information to acting on what the information shows.
5. Project Status Updates
Status reporting is a good example of work that often exists because systems are disconnected.
If a project manager already knows:
- Current completes
- Remaining quotas
- Supplier delivery
- Project status
- Timeline
- Quality issues
there is little value in manually copying those same numbers into another report every day.
A research operations dashboard can use live project information to keep status views updated.
Automated notifications can also be triggered when something requires attention, such as a quota reaching its limit or a project falling behind schedule.
The system handles the routine update. The project manager handles the exception.
6. Respondent and Survey Communication
Automation can also reduce repetitive communication.
Depending on the research model, this can include:
- Survey Invitations
- Reminder Emails
- Qualification Notifications
- Panelist Updates
- Reward Notifications
- Project Status Messages
- Client Notifications
For companies managing an owned panel, this can be connected with panel management software development, where respondent profiles, survey matching, invitations, participation, and rewards are managed within the same environment.
The important point is to automate communication based on known events rather than sending messages manually every time.
7. Data Quality Checks
Automation can help identify responses that require review.
Rules may flag:
- Duplicate Respondents
- Speeding
- Straightlining
- Failed Attention Checks
- Suspicious Device Information
- Invalid Redirects
- Inconsistent Responses
This does not mean every flagged respondent should automatically be rejected.
A better workflow separates routine checks from judgment calls. The software identifies unusual responses, while researchers or quality teams review cases that require context.
GreenBook similarly notes that automation can reduce repetitive data handling and human error while researchers retain responsibility for higher-value research work.
8. Supplier Reconciliation
Supplier reconciliation can become time-consuming when several sample providers are involved.
Suppose the internal project record shows:
| Supplier | Delivered | Accepted | Supplier Claim |
| Supplier A | 425 | 410 | 425 |
| Supplier B | 320 | 320 | 320 |
| Supplier C | 295 | 286 | 292 |
Supplier B matches the project record.
Suppliers A and C need review.
Instead of manually comparing spreadsheets after the project closes, the platform can match supplier claims against accepted project records and flag only the differences.
This is a good example of useful automation: automate the comparison, not the decision about the discrepancy.
9. Client and Supplier Invoicing
By the time a project reaches finance, much of the information needed for billing should already exist.
The project may already contain:
- Client Rate
- Supplier CPI
- Accepted Completes
- Additional Charges
- Currency
- PO Number
- Supplier Costs
- Payment Terms
If finance has to enter this information again, the workflow is disconnected.
A connected platform can prepare invoice data from approved project records, route it for review, and keep invoice status tied to the project.
This matters because research project management extends beyond fieldwork. OnGraph’s project management platform explicitly covers client and supplier invoicing and payment reconciliation alongside bidding, fielding, quotas, and reporting.
10. Reporting
Research reporting contains two very different kinds of work.
The first is repetitive:
- Updating Standard Charts
- Applying Existing Filters
- Refreshing Dashboards
- Formatting Recurring Reports
- Exporting Data
The second requires judgment:
- Explaining Why Results Changed
- Identifying Important Findings
- Understanding Context
- Connecting Findings to Business Decisions
The first group is a strong candidate for automation.
The second is where researchers add value.
Voxco and GreenBook both identify data collection, analysis, and reporting as areas where automation can reduce repetitive research work.
Build Automation Around Your Research Process
What Should You Automate First?
Trying to automate the entire research operation at once usually creates unnecessary complexity.
Start with workflows that are frequent, repetitive, rules-based, and expensive to perform manually.
A simple prioritization model can help:
| Process | Frequency | Manual Effort | Rules Clear? | Automation Priority |
| Project Setup | High | Medium | Yes | High |
| Supplier Feasibility | High | High | Mostly | High |
| Quota Monitoring | High | High | Yes | High |
| Status Reporting | High | Medium | Yes | High |
| Reconciliation | High | High | Yes | High |
| Invoice Preparation | Medium | High | Yes | High |
| Research Interpretation | High | High | No | High |
| Client Strategy | Medium | High | No | High |
The processes on the right are not less important.
They are simply less suitable for rule-based automation.
What Automation Should Not Do
Automation becomes risky when teams automate a process before understanding it.
If the existing workflow contains unclear ownership, inconsistent rules, or poor-quality data, automating it can make the same problem happen faster.
Before automating a workflow, confirm:
Who owns the decision?
A system should not approve something simply because nobody has defined who is responsible.
What are the rules?
If project managers handle the same situation differently every time, the workflow may need standardization first.
Where does the source data come from?
Automation only works reliably when the system knows which record is authoritative.
Which exceptions require review?
The workflow should make unusual situations visible rather than forcing them through the normal path.
This is particularly important for respondent quality, pricing changes, reconciliation disputes, and client-specific project requirements.
Generic Automation Tools vs Research-Specific Software
Research agencies can automate some work using generic workflow platforms.
The limitation appears when the workflow reaches research-specific data.
| Capability | Generic Workflow Tool | Market Research Automation Software |
| Tasks and Approvals | Strong | Strong |
| Email Notifications | Strong | Strong |
| Project Timelines | Strong | Strong |
| Research Bids | Custom Setup | Purpose-Built |
| Supplier Feasibility | Limited | API-Based |
| Qualifications | Limited | Research-Specific |
| Quotas | Limited | Research-Specific |
| Live Completes | Custom Integration | Native Workflow |
| Incidence/LOI | Limited | Research-Specific |
| Supplier Reconciliation | Manual/Custom | Connected |
| Research Invoicing | Separate System | Can Connect to Project |
| Panel Integration | Custom | Research-Specific |
Generic tools are useful when the requirement is task automation.
Purpose-built software becomes more relevant when the data being automated is itself research-specific.
How Much Manual Work Can Research Automation Reduce?
There is no reliable universal percentage for how much manual work a market research agency will eliminate through automation. The answer depends on project volume, supplier count, existing systems, integration coverage, and how standardized the agency’s workflows already are.
Claims such as “automation reduces research work by 50%” should therefore be treated carefully unless they are tied to a specific workflow and measured implementation.
Better evidence comes from measuring your own baseline.
Before implementation, record:
- Time From Accepted Bid to Project Setup
- Time Spent Requesting Supplier Feasibility
- Hours Spent Monitoring and Reporting
- Time Required for Reconciliation
- Time From Project Close to Client Invoice
- Number of Manual Data Entries per Project
- Number of Corrections or Rework Cases
Measure the same figures after automation.
That gives the agency its own ROI evidence rather than relying on a generic industry percentage.
There is, however, a broader reason research businesses are investing more heavily in technology. ESOMAR data cited in OnGraph’s current project-management research puts the research software sector at approximately $62 billion in 2024, with 11.5% annual growth, compared with 4.8% for research services.
How to Implement Market Research Automation Software
The safest approach is to improve one connected workflow at a time.
Step 1: Map the Existing Workflow
Document how a project currently moves from bid to delivery.
Include every spreadsheet, email, portal, approval, and manual data entry.
Step 2: Find Repeated Handoffs
Look for places where information is copied from one system into another.
These are often the strongest automation opportunities.
Step 3: Define the Source of Truth
Decide which system owns client information, project data, supplier rates, respondent status, costs, and invoice records.
Without this, connected systems can produce conflicting values.
Step 4: Define Rules and Exceptions
Write down what should happen automatically and what requires review.
For example, reaching a quota limit can automatically stop traffic, while a supplier reconciliation discrepancy may require project-manager approval.
Step 5: Connect the Systems
Integrate survey platforms, sample suppliers, panels, fraud tools, CRM, reporting, accounting, and other systems needed by the workflow.
OnGraph reports 65+ panel integrations and 40+ API integrations across its research technology stack. These are company-published figures rather than independent industry benchmarks, but they illustrate how integration-heavy mature research operations can become.
Step 6: Measure the Result
Compare the new workflow with the baseline.
If automation does not reduce manual work, errors, turnaround time, or operational effort, review the process before expanding it further.
When Custom Market Research Automation Software Makes Sense
A ready-made platform may be enough when your workflow is standard and the required integrations already exist.
Custom market research software development becomes more relevant when your operations depend on proprietary workflows, unusual supplier models, custom client portals, specific billing rules, internal systems, or data requirements that standard platforms cannot support.
Custom development can also make sense when your team already uses several useful systems and does not want to replace them.
In that case, the goal may be to build a connected operations layer around those systems rather than rebuilding everything.
This distinction matters.
Automation does not require replacing your entire technology stack.
Sometimes the best solution is simply getting the systems you already use to exchange the right information at the right time.
Turn Repetitive Research Tasks Into Connected Workflows
Where OnGraph Fits
OnGraph develops software for research agencies, panel companies, and research teams that need to connect operational workflows.
Its market research technology can bring bidding, project setup, supplier integrations, qualifications, quotas, fieldwork monitoring, fraud controls, reporting, reconciliation, and invoicing into a connected environment. OnGraph’s published platform figures include 8M+ surveys completed, 65+ panel integrations, and 40+ API integrations.
The important part for an agency is not the number of features in the platform.
It is deciding which manual handoffs are costing the team time today and connecting those workflows first.
The Bottom Line
Market Research Automation Software should not be judged by how many tasks it can automate.
It should be judged by how much unnecessary work it removes from a research project without weakening control or data quality.
The best opportunities are usually repetitive handoffs: entering the same project details twice, requesting supplier information manually, checking quotas across systems, rebuilding status reports, reconciling completes, and preparing invoice data.
Research decisions still belong with researchers and project managers.
The software should handle the repetitive work around those decisions.
When that distinction is clear, automation does not replace the research team. It gives the team more time to run projects, solve problems, work with clients, and interpret the research.
FAQs
Market Research Automation Software connects and automates repetitive tasks across research operations. Depending on the platform, this can include project setup, survey workflows, supplier coordination, quota monitoring, reporting, reconciliation, and invoicing.
Good candidates include project creation, supplier feasibility requests, quota monitoring, status updates, survey invitations, routine quality checks, reconciliation comparisons, invoice preparation, and recurring reporting.
No. Research design, interpretation, client discussions, unusual quality issues, and methodology decisions still require human judgment. Automation is most useful for repetitive and rules-based operational work.
General workflow tools manage tasks, approvals, notifications, and timelines. Research workflow software can also understand research-specific information such as quotas, suppliers, completes, incidence rates, respondent statuses, reconciliation, and project costs.
Start by mapping the current workflow and identifying where the same information is repeatedly entered, checked, transferred, or reported. Automate a high-frequency workflow first and measure the result before expanding.
Yes. Survey platforms, supplier APIs, panels, fraud tools, CRM, finance software, and reporting systems can often be connected. A new platform does not always need to replace every existing tool.
Measure operational metrics before and after implementation. Useful measures include project setup time, reporting hours, reconciliation time, invoice turnaround, manual data entries, corrections, and projects handled per project manager.
Custom software becomes useful when standard platforms cannot support your workflow, integrations, supplier model, billing rules, client experience, or data requirements. It can also connect existing systems without forcing the agency to replace its full technology stack.
About the Author

Let’s Create Something Great Together!
Latest Blog

Let’s have a conversation today!


India
ONGRAPH TECHNOLOGIES PRIVATE LIMITED,
SDF L-1, NSEZ,
Sector 81, Block L, Phase-2,
Noida, Uttar Pradesh-201305

USA
OnGraph Technologies,
120 Bethpage Rd, Suite 304,
Hicksville, NY 11801, USA

Canada
7-1039 CEDARGLEN GATE,
Mississauga, Ontario,
Canada L5C 3A7

UK
89 Banstead Road South,
Sutton, Surrey, SM2 5LH
United Kingdom

Malaysia
G-3A, Amaya Maluri, Jalan
Jejaka 2, Taman Maluri,
KL–55100, Malaysia

Singapore
10 Anson Road,#26-04
International Plaza,
Singapore (079903)