


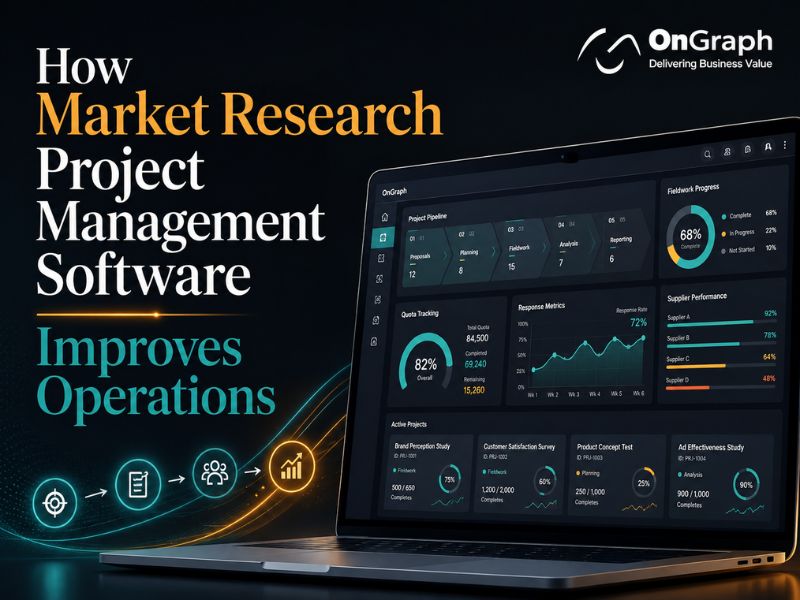
Market research project management software can improve operations in five clear ways: faster bid-to-field cycles, better control over live fieldwork, clearer project margins, fewer manual errors, and more capacity for each project manager.
This matters because operational efficiency is becoming harder to maintain across professional services. SPI Research’s 2025 benchmark puts industry billable utilization at 68.9%, its lowest level since 2019. On-time delivery also fell from 80.2% to 73.4% over three years. GreenBook’s analysis of the 2025 GRIT Business Outlook found a similar gap, with tech-forward research suppliers scoring 98.2 on its revenue-health index compared with 34.0 for full-service firms.
This article looks at where project management software can improve the research lifecycle and the published evidence behind those improvements.
Turn Fragmented Research Operations Into One Connected Platform
The Baseline: What Fragmented Research Operations Cost
Many research agencies still manage projects across several disconnected tools. Generic project management software handles tasks, spreadsheets track quotas and costs, email manages supplier communication, and a separate finance system handles invoicing.
A decade-old Deltek-sponsored article in Quirk’s described this four-system setup, and it still looks familiar today. More recent workplace data shows how much time this type of setup can consume.
Wellingtone’s 2021 State of Project Management survey, the latest openly published edition, found that 47% of project professionals do not have access to real-time project KPIs. It also found that 50% spend at least one day every month manually putting together status reports. The same report identified reporting automation as one of the quickest benefits of introducing project management technology.
Asana’s 2023 Anatomy of Work index, based on 9,615 knowledge workers, found that 58% of the workday was spent on “work about work.” A 2022 Harvard Business Review study also estimated that switching between applications alone takes up around 9% of annual work time.
Research operations add another layer of complexity. Rebel’s Guide to Project Management’s 2024 practitioner survey found that most project managers handle two to five projects at the same time, while 54% do not track time at all.
For a research PM, that often means managing quotas, suppliers, costs, and margins across systems that do not share data with each other.
5 Operational Improvements, Mapped to the Research Lifecycle
1. Faster bid-to-field cycles
The bidding stage shapes the economics of a research project, and manual processes can easily add days to it.
Feasibility and pricing that once moved through long email chains can now be handled through APIs. Sample marketplaces such as Cint and PureSpectrum state that they can return feasibility and CPI estimates within seconds. However, that speed only helps when the project management platform can connect directly with those APIs.
Purpose-built research project management software can also turn an accepted bid into a live project without entering the same information again. Audience definitions, quotas, and costs can move directly from the bid into fieldwork.
This can reduce the time between quotation and field launch from days to hours. Over time, that can help teams respond to more opportunities and handle more projects each quarter.
2. Live fieldwork control
Generic workflow management software is mainly designed to track tasks. Research operations need to track different metrics, including completes, incidence rates, length of interview, and termination rates.
A market research project management tool built specifically for research can monitor these numbers in real time. It can check incidence and length-of-interview assumptions during soft launch, pace quotas, identify changes during fieldwork, and manage supplier traffic from one dashboard.
This gives project managers a chance to fix problems while the study is still running.
Without that visibility, teams may discover after fieldwork closes that a quota cell was not filled and the project needs to be reopened. A supplier may also deliver more completes than the client ordered. Both situations directly affect project margins.
3. Per-project margin visibility
Research margins are often decided during reconciliation.
This means matching recorded completes with supplier-claimed completes using transaction IDs, accounting for rejected or reversed responses, and comparing projected cost per complete with the final cost.
When this work is managed through spreadsheets and month-end finance processes, teams may not see the true project margin until weeks later.
An integrated platform can make this information available throughout the project.
Finance operations data also shows the effect automation can have on related processes. Ardent Partners’ 2025 State of ePayables benchmark found that the average invoice takes 8.2 days to move from receipt to ready-to-pay. With advanced automation, that falls to 2.9 days. Best-in-class teams also operate at roughly 79% lower processing costs.
OnGraph’s supplier management software guide explains the research reconciliation process in more detail, including projected versus actual costs, quality rejections, and currency rules.
4. Fewer errors in the data that runs the business
Entering the same information manually across systems does more than slow teams down. It also creates opportunities for mistakes.
A 2023 peer-reviewed meta-analysis of clinical research data processing found a pooled error rate of 6.57% for manual record abstraction. Direct or double-verified data entry had an error rate of only 0.14–0.29%, a difference of at least twenty times.
In research operations, similar manual errors can appear in quota trackers, cost sheets, and supplier reconciliation files. A single incorrect number can affect project profitability without being noticed immediately.
Purpose-built platforms reduce the need to re-enter data. They can also run quality controls during fieldwork rather than waiting until the project is finished. S2S callbacks, hashing, deduplication, and fraud checks can happen automatically as responses move through the system.
5. More capacity without more headcount
SPI Research’s 2025 Professional Services Maturity Benchmark provides some of the strongest independent data in this area.
The study covered 403 firms and found that organizations using a commercial professional-services platform achieved 70.2% billable utilization compared with 65.0% for non-users. They also reported 6.1% revenue growth versus 1.6%, along with project margins of 36.9% compared with 33.3%.
SPI also gives a practical example of what this difference can mean. For a 100-person services organization, a 5.2 percentage-point increase in utilization represents roughly 10,400 additional billable hours each year.
Not every metric improves in the same way. The same SPI data shows that platform users reported slightly lower on-time delivery than non-users, although they were also managing substantially larger projects.
That distinction matters. Software does not guarantee better schedules. Its stronger case is around utilization, margins, growth, and reducing administrative work.
Vendor-commissioned studies sometimes report larger gains. For example, a Forrester study for monday.com said weekly status meetings fell from five hours to one. Even without relying on those larger claims, independent benchmarks point in the same direction: software can take over more coordination work and give researchers more time to focus on research.
Build Software Around Your Research Workflow, Not the Other Way Around
The Benchmarks in One Table
| Operational Metric | Without Platform | With Platform | Source |
| Billable utilization | 65.0% | 70.2% | SPI Research 2025 (professional services, n=403) |
| Year-over-year revenue growth | 1.6% | 6.1% | SPI Research 2025 |
| Project margin | 33.3% | 36.9% | SPI Research 2025 |
| Invoice cycle time | 8.2 days | 2.9 days | Ardent Partners 2025 |
| Manual data error rate | 6.57% (manual abstraction) | 0.14–0.29% (verified entry) | Peer-reviewed clinical-research meta-analysis, 2023 |
| Status reporting | 1+ days/month manual | Named the top automation quick-win | Wellington State of PM (2021) |
SPI figures cover professional services broadly, not research agencies specifically. SPI’s platform users also show slightly lower on-time delivery while managing substantially larger projects. The Ardent and error-rate figures come from related areas — invoice processing and clinical data entry — and are used here as comparisons for the billing and data processes that research platforms can automate. Vendor-commissioned ROI studies are excluded.
Why Generic Project Management Software Falls Short
Tools such as Asana, monday.com, and ClickUp work well for tasks, timelines, approvals, and general project coordination.
The limitation is that they are not built around the research data model.
Generic project management tools do not naturally understand quotas, incidence rates, supplier APIs, completes, or reconciliation. Their automation limits can also become restrictive as operations scale.
Because of this, research agencies using generic project management software often still manage the actual fieldwork in spreadsheets. That means many of the manual processes described earlier remain in place.
The full comparison, including a weighted selection scorecard, is available in OnGraph’s guide to market research project management tools.
Where OnGraph Fits
OnGraph builds project management software specifically for research companies.
These platforms can bring bid management, fieldwork monitoring, supplier API integrations, qualification and quota management, fraud protection, and client and supplier invoicing into one system.
Solutions can be delivered through custom market research software development or as white-label platforms. OnGraph also provides panel management software development for companies that manage their own research panels.
The company reports more than 8M surveys completed through its research technology stack, along with 65+ panel integrations and 40+ API integrations. Its guide to automating research operations from bid to final report explains how these processes can work together across the full research lifecycle.
Ready to Modernize Your Research Operations?
The Bottom Line
Every research project already produces the information an agency needs to operate more efficiently — quotas, completes, costs, and margins.
The problem is often where that information sits and how quickly teams can use it.
Software designed for research workflows brings that data together while the project is still active. This gives teams more time to act on problems, control costs, and make better operational decisions.
FAQs
Many agencies still use a combination of generic project management tools, spreadsheets for quotas and costs, email for supplier communication, and separate finance systems.
This fragmented setup helps explain why 50% of project professionals spend at least one day each month manually creating status reports. Most project managers also handle two to five projects at the same time.
Purpose-built research platforms can bring these processes together in a single bid-to-invoice system.
Independent benchmarks from the wider professional-services industry give a useful reference point.
SPI Research’s 2025 study found that platform users achieved 70.2% billable utilization compared with 65.0% for non-users. They also recorded 6.1% revenue growth versus 1.6% and project margins of 36.9% compared with 33.3%.
Vendor-commissioned studies sometimes report larger gains, but the independent figures provide a more conservative basis for planning.
Generic tools work well for tasks, timelines, approvals, and team coordination. However, they are not designed around research-specific requirements such as quotas, incidence tracking, supplier integrations, completes, and reconciliation.
As a result, many agencies still manage fieldwork through spreadsheets alongside their project management software.
Manual data handling also carries a much higher error rate than verified or automated data entry, which adds another operational risk.
Two of the main areas are reconciliation and utilization.
Continuous reconciliation lets teams compare recorded completes with supplier-claimed completes while the project is still running. This makes it easier to identify cost overruns before the project is finished.
Automation also reduces time spent on coordination and administrative work. In SPI Research’s 2025 benchmark, the 5.2 percentage-point utilization difference between platform users and non-users represents roughly 10,400 additional billable hours per year for a 100-person organization.
A research project management platform should connect with survey engines, sample supplier and buyer APIs, panel management software, reward and payment providers, fraud detection services, CRM systems, and accounting tools.
Integration coverage is one of the most practical things to evaluate when selecting a platform. Mature research technology stacks may need dozens of connections.
OnGraph, for example, reports 65+ panel integrations and 40+ API integrations. Every system that remains disconnected creates another place where data, completes, or costs may need to be reconciled manually.
About the Author

Let’s Create Something Great Together!
Latest Blog


Let’s have a conversation today!


India
ONGRAPH TECHNOLOGIES PRIVATE LIMITED,
SDF L-1, NSEZ,
Sector 81, Block L, Phase-2,
Noida, Uttar Pradesh-201305

USA
OnGraph Technologies,
120 Bethpage Rd, Suite 304,
Hicksville, NY 11801, USA

Canada
7-1039 CEDARGLEN GATE,
Mississauga, Ontario,
Canada L5C 3A7

UK
89 Banstead Road South,
Sutton, Surrey, SM2 5LH
United Kingdom

Malaysia
G-3A, Amaya Maluri, Jalan
Jejaka 2, Taman Maluri,
KL–55100, Malaysia

Singapore
10 Anson Road,#26-04
International Plaza,
Singapore (079903)