


In this article
- Why Multi-Supplier Quota Tracking Gets Complicated
- Supplier-Level Tracking Is Not the Same as Survey-Level Tracking
- Start With One Source of Truth for Quotas
- Track More Than Total Completes
- Track Completes by Supplier and Quota
- Use Standard Respondent Statuses Across Suppliers
- Protect Against Over-Quota Completes
- Do Not Treat Every Recorded Complete as a Final Complete
- Keep Quota Progress and Quality Review Connected
- Use Alerts Before a Quota Becomes a Problem
- Compare Suppliers on Delivery, Not Just Volume
- A Practical Multi-Supplier Fieldwork Workflow
- Spreadsheet Tracking vs Connected Quota Management
- What Should a Multi-Supplier Quota Dashboard Show?
- When Does Custom Quota Tracking Make Sense?
- The Bottom Line
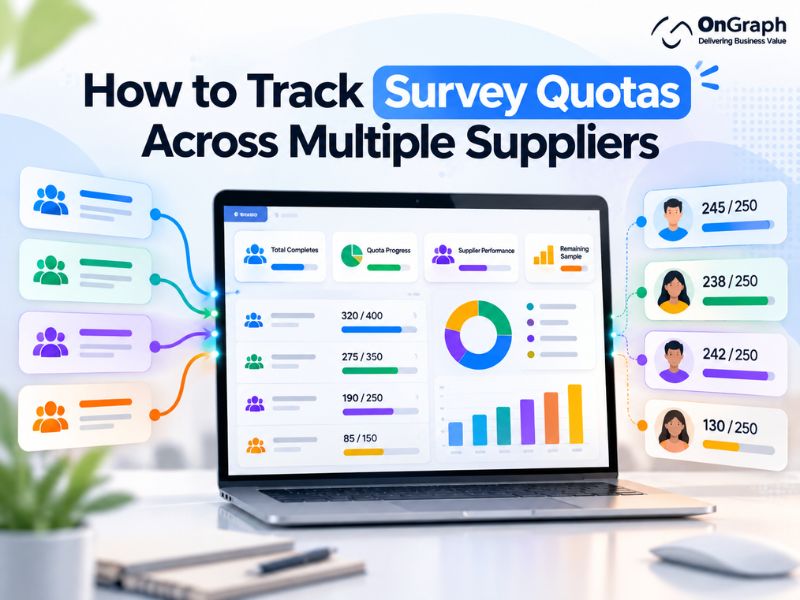
Survey quota tracking becomes much harder when a research project uses more than one sample supplier. One supplier may be delivering completes quickly while another is still sending traffic into a segment that is almost full. At the same time, project managers need to know which completes are valid, which quotas are still open, and how much sample each supplier should continue sending.
Tracking this through separate supplier portals and spreadsheets creates a simple problem: every supplier may have its own numbers, but the research team still needs one reliable view of the project.
The goal is not simply to count completes. A good system should answer four questions at any point during fieldwork:
- How many valid completes do we have?
- Which quota cells are still open?
- Which supplier delivered each complete?
- Should each supplier continue, slow down, or stop?
That becomes especially important as research operations grow. ESOMAR reported that the global insights industry expanded 8% in 2023, from almost $130 billion to $142 billion. In India, MRSI reported that the research and insights industry reached INR 29,008 crore in FY2025, up 10.9% from FY2024.
Why Multi-Supplier Quota Tracking Gets Complicated
Consider a survey with a target of 1,000 completes.
The project uses three sample suppliers:
| Supplier | Allocated Target | Reported Completes |
| Supplier A | 400 | 320 |
| Supplier B | 350 | 275 |
| Supplier C | 250 | 190 |
| Total | 1,000 | 785 |
At the overall level, this looks manageable.
But the client may also require:
- 50% male and 50% female respondents
- Defined age bands
- Regional targets
- Specific income groups
- Product-user segments
A respondent may therefore count toward several conditions at once.
Compound quotas make this more complex. IntelliSurvey, for example, distinguishes simple quotas from compound quotas where respondents must meet multiple criteria. QuestionPro similarly supports nested and interlocking quotas across multiple attributes.
Now add three suppliers sending respondents at the same time.
The project manager is no longer tracking one number. The team needs to understand quota availability across every supplier in near real time.
Manage Every Supplier From One Place
Supplier-Level Tracking Is Not the Same as Survey-Level Tracking
Most survey platforms can tell you whether a quota is open or full.
Alchemer, for example, provides overall and segmented quota monitoring with complete counts, percentage progress, days in field and average responses per day. QuestionPro supports live quota counts and can automatically close a quota when its target is reached.
Those features solve the survey-level problem.
A research agency working with several suppliers has another layer to manage.
It needs to know:
| Survey-Level Question | Supplier-Level Question |
| How many completes have we received? | Which supplier delivered them? |
| Is the quota open? | Which suppliers are still sending traffic to it? |
| How many completes remain? | How should remaining completes be allocated? |
| Is the overall target complete? | Which supplier should be paused? |
| How many respondents terminated? | What is each supplier’s conversion and quality? |
| What is the final sample? | What should each supplier be paid for? |
This is where multi-supplier survey management becomes an operational requirement rather than just a survey-programming feature.
For agencies managing many sample providers, market research supplier management software can connect supplier feasibility, fieldwork, quotas, quality, costs and reconciliation within the same project workflow. OnGraph’s existing supplier-management guide covers these wider supplier operations in detail.
Start With One Source of Truth for Quotas
The most important design decision is deciding which system owns the quota status.
If Supplier A’s portal says 18 slots remain, Supplier B’s spreadsheet says 15, and the survey platform says 12, the team does not have three useful reports. It has a synchronization problem.
A central project system should maintain the operational view of:
- Quota name and definition
- Target completes
- Valid completes
- Remaining completes
- In-progress respondents where available
- Supplier allocation
- Supplier delivery
- Quota status
- Last update time
OnGraph’s Market Research Project Management Software already approaches fieldwork this way by bringing survey fielding, qualifications, quotas and supplier integrations into a common project environment. (OnGraph)
The important part is that every project manager is looking at the same definition of progress.
Still Tracking Quotas in Spreadsheets?
Track More Than Total Completes
A project showing 800/1,000 completes does not necessarily mean it is 80% finished.
Suppose the project looks like this:
| Quota | Target | Valid Completes | Remaining | Status |
| Male 18–34 | 250 | 245 | 5 | Near Full |
| Male 35+ | 250 | 238 | 12 | On Track |
| Female 18–34 | 250 | 242 | 8 | Near Full |
| Female 35+ | 250 | 130 | 120 | Underfilled |
Total completes are 855.
The project is technically 85.5% filled, but the remaining 145 completes are not interchangeable.
Most of the remaining sample must come from one specific group.
This is why a useful survey quota management dashboard needs to show both overall progress and individual quota cells.
Track Completes by Supplier and Quota
The next layer is supplier contribution.
Instead of showing only:
Female 35+: 130 / 250
show:
| Supplier | Valid Completes | Remaining Allocation | Current Status |
| Supplier A | 65 | 35 | Continue |
| Supplier B | 40 | 60 | Continue |
| Supplier C | 25 | 25 | Continue |
| Total | 130 | 120 | Open |
Now the project manager can see where delivery is coming from and where additional sample may be needed.
This also makes it easier to compare supplier performance later.
A supplier that delivered 300 total completes may appear stronger than one that delivered 150. But if the second supplier filled the hardest quota cells, its contribution may have been more valuable to the project.
Use Standard Respondent Statuses Across Suppliers
Different suppliers may use different terminology for respondent outcomes.
Your internal platform should normalize those outcomes into a consistent set.
For example:
Complete — Respondent successfully finished and passed required checks.
Terminate — Respondent did not meet the survey qualification criteria.
Quota Full — Respondent qualified, but the relevant quota no longer had capacity.
Quality Reject — Response was removed because it failed defined quality checks.
In Progress — Respondent has entered the survey but has not reached a final status.
A common status model prevents reporting from changing depending on which supplier provided the traffic.
This is also where survey panel integration becomes important when research teams are connecting panels and respondent sources across markets.
Protect Against Over-Quota Completes
One of the harder fieldwork problems occurs near the end of a quota.
Imagine there are 5 places left, but 15 qualified respondents from several suppliers are already taking the survey.
Simply closing new traffic may not solve the problem because those respondents have already entered.
QuestionPro specifically documents a second quota check for longer surveys. It rechecks availability later in the respondent journey to reduce situations where several respondents pass the initial quota check and reach a nearly full quota simultaneously.
Alchemer also warns about high volumes of respondents being in progress when an overall quota is close to filling.
For multi-supplier projects, the system therefore needs more than a progress bar.
Useful controls include:
- Near-full thresholds
- Supplier throttling
- Pause controls
- In-progress awareness
- Quota rechecks
- Quota-full redirects
- Small operational buffers where appropriate
The exact rule should depend on the survey platform, supplier agreements and project requirements.
Do Not Treat Every Recorded Complete as a Final Complete
This distinction is important.
Raw completes are respondents who reached the survey completion point.
Valid completes are responses that remain after the project’s agreed quality checks and reconciliation.
Suppose a supplier sends 220 recorded completes.
After review:
- 8 fail quality checks
- 4 are duplicates
- 3 are removed for another agreed reason
The final count becomes 205 valid completes.
If the quota dashboard continues to show 220 while supplier reconciliation uses 205, operations and finance are working from different numbers.
Your system should therefore preserve the history rather than simply overwrite the original count:
Recorded → Reviewed → Accepted/Rejected → Final Valid Complete
This becomes particularly important when supplier invoices are based on accepted completes.
Keep Quota Progress and Quality Review Connected
Quota management should not stop when a quota reaches its target.
IntelliSurvey recommends reviewing data during fieldwork rather than waiting until fieldwork ends, because removing poor-quality responses later can reopen quota gaps.
For example:
Target: 100
Collected: 100
Quality rejects: 7
Valid completes: 93
Remaining: 7
A dashboard that only says 100% complete creates the wrong operational signal.
The quota should either reopen or clearly show that seven replacement completes are required.
That connection between fieldwork and quality control is one reason broader market research workflow automation can be useful. It connects quotas, suppliers, project progress, costs and reporting instead of treating each step as an isolated activity.
Build Smarter Survey Quota Management
Use Alerts Before a Quota Becomes a Problem
Project managers should not have to watch every progress bar throughout the day.
Instead, define operational thresholds.
For example:
| Trigger | Possible Action |
| Quota reaches 80% | Review current supplier traffic |
| Quota reaches 95% | Reduce or pause high-volume sources |
| Quota reaches 100% | Stop eligible traffic |
| Quota remains below expected pace | Review feasibility or supplier allocation |
| Quality rejection rate increases | Review supplier traffic |
| Valid completes fall below target | Reopen required cells |
These are examples rather than universal thresholds. Each research agency should set rules based on survey length, traffic volume, incidence, supplier response times and client requirements.
The important point is that the project manager sees the exception instead of manually searching for it.
Compare Suppliers on Delivery, Not Just Volume
Once supplier-level data is connected, research teams can evaluate suppliers using more useful measures.
A supplier dashboard may include:
- Assigned completes
- Valid completes
- Fill rate
- Termination rate
- Quota-full rate
- Quality rejection rate
- Cost per valid complete
- Hard-to-fill quota contribution
- Delivery against agreed timeline
This provides more context than ranking suppliers only by the number of completes delivered.
It can also improve future feasibility and sourcing decisions because the team has a record of how suppliers performed on previous projects.
A Practical Multi-Supplier Fieldwork Workflow
A connected workflow can operate like this:
1. Define the project’s qualifications and quotas.
Create the total sample requirement and the demographic, geographic, behavioral or other quota cells required by the study.
2. Allocate sample across suppliers.
Set initial targets based on feasibility, CPI, geography, audience availability and previous supplier performance.
3. Connect supplier traffic to the project.
Use available APIs, callbacks, redirects or other supported integrations so respondent outcomes can be tied back to the correct project and supplier.
4. Monitor quota progress centrally.
Track total, supplier-level and quota-cell completes rather than opening separate supplier portals.
5. Adjust fieldwork when needed.
Slow, pause or increase supplier allocation based on remaining quotas, quality and delivery pace.
6. Review response quality.
Separate recorded completes from valid completes and reopen quota requirements where rejected responses create gaps.
7. Reconcile the final project.
Confirm accepted completes by supplier before final reporting and supplier invoicing.
This wider project lifecycle can also sit inside survey project management software, connecting survey setup and fieldwork with the processes before and after data collection.
Spreadsheet Tracking vs Connected Quota Management
| Area | Spreadsheet / Separate Portals | Connected Quota Management |
| Overall completes | Manually consolidated | Shared project view |
| Quota progress | Updated manually | Live or regularly synchronized |
| Supplier contribution | Separate reports | Supplier-level view |
| Remaining sample | Manually calculated | Calculated from current valid data |
| Quality rejects | Often reconciled later | Connected to valid-complete count |
| Over-quota control | Manual communication | Thresholds, pauses and redirects where supported |
| Supplier comparison | End-of-project exercise | Ongoing performance visibility |
| Reconciliation | Spreadsheet matching | Completes tied to supplier records |
| Audit history | Difficult to reconstruct | Status and change history can be retained |
The value is not simply having another dashboard. It is reducing disagreement about which number is current and what action needs to happen next.
What Should a Multi-Supplier Quota Dashboard Show?
Keep the dashboard operational.
At minimum, a project manager should be able to see:
- Overall target and valid completes
- Remaining completes
- Individual quota progress
- Supplier allocation and delivery
- Open and closed quota cells
- Near-full quotas
- Recorded versus valid completes
- Quality rejections
- Supplier costs where relevant
- Fieldwork pace
- Last synchronization time
From there, the user should be able to drill down into the underlying supplier, quota or respondent records.
A dashboard is most useful when a number can be investigated rather than simply displayed.
When Does Custom Quota Tracking Make Sense?
A standard survey platform may be enough if you run straightforward studies with one sample source and relatively simple quotas.
Custom development becomes more relevant when your agency regularly manages:
- Several suppliers per project
- Nested or interlocking quotas
- Multiple countries
- Different supplier APIs
- Custom redirect rules
- Client-facing fieldwork dashboards
- Quality-based complete reconciliation
- Supplier cost tracking
- Custom alerts and approval rules
- Project-to-invoice workflows
In these cases, the requirement is broader than a quota feature.
It becomes a research operations system.
OnGraph’s Market Research Software Development services cover custom research platforms and integrations for these types of workflows. Its project-management platform also supports qualifications, quotas, supplier integrations, fieldwork and reporting. OnGraph reports 8M+ surveys completed, 65+ panel integrations and 40+ API integrations across its research technology work; these are company-published figures rather than independent industry benchmarks.
Need a Custom Research Operations Platform?
The Bottom Line
Survey quota tracking becomes difficult when several suppliers are working against the same targets.
The answer is not another spreadsheet that combines yesterday’s numbers. Research teams need a shared view of valid completes, remaining quota, supplier contribution, quality status and fieldwork pace.
Start with one source of truth. Standardize supplier statuses. Track completes by quota and supplier. Account for quality rejects. Add controls for quotas that are close to full. Then connect final accepted completes to supplier reconciliation.
That gives project managers something more useful than a quota progress bar: a clear view of what has been delivered, what is still needed, and where the remaining sample should come from.
FAQs
Survey quota tracking is the process of monitoring how many respondents have completed a survey within specific groups, such as age, gender, location, or customer type. It helps research teams see which quotas are filled, nearly full, or still need respondents.
Use one central system that records each supplier’s traffic, completed surveys, quota status, and valid completes. This gives project managers a single view instead of checking separate supplier portals and spreadsheets.
Set quota limits and near-full alerts, monitor respondents already in progress, and pause or redirect supplier traffic when a quota approaches its target. Quota rechecks can also help prevent additional respondents from entering a full segment.
A survey complete is a respondent who reaches the end of the survey. A valid complete is a response that remains after required quality checks, duplicate checks, and project-specific validation. Supplier reconciliation should normally use valid completes.
A useful dashboard should track total targets, valid completes, remaining completes, individual quota progress, supplier contribution, quality rejections, fieldwork pace, and near-full or closed quotas. It should also show when the data was last updated.
About the Author

Let’s Create Something Great Together!
Latest Blog

Let’s have a conversation today!


India
ONGRAPH TECHNOLOGIES PRIVATE LIMITED,
SDF L-1, NSEZ,
Sector 81, Block L, Phase-2,
Noida, Uttar Pradesh-201305

USA
OnGraph Technologies,
120 Bethpage Rd, Suite 304,
Hicksville, NY 11801, USA

Canada
7-1039 CEDARGLEN GATE,
Mississauga, Ontario,
Canada L5C 3A7

UK
89 Banstead Road South,
Sutton, Surrey, SM2 5LH
United Kingdom

Malaysia
G-3A, Amaya Maluri, Jalan
Jejaka 2, Taman Maluri,
KL–55100, Malaysia

Singapore
10 Anson Road,#26-04
International Plaza,
Singapore (079903)